Hyperspectral Darkfield Characterization of Gold Nanoparticles: Identification and Localisation
Darkfield microscopy coupled with hyperspectral imaging provides an efficient way to study nanomaterials in tissue, live cells or solution. Scattered light from plasmonic or other nanostructures provides useful information on their composition, size and distribution.
Photon etc. provides two different platforms for hyperspectral darkfield imaging: a Tunable laser source (TLS) allowing filtering in excitation and IMA, a platform providing emission filtering.
The TLS is composed of two modules: a supercontinuum source (broadband source) and a laser line tunable filter (LLTF - bandpass filter) based on Photon etc.’s volume Bragg grating (VBG) technology. IMA is composed of a hyperspectral imaging filter, the hypercube, also based on VBG. When combined with a research-grade microscope equipped with a darkfield condenser, the TLS and hypercube can transform this microscope into a hyperspectral darkfield setup. Those systems are continuously tunable in the VIS (400-1000 nm), NIR (900-1620) nm or both (400-1620 nm) spectral ranges. This state-of-the-art platform allows in-depth characterization of nanomaterials without any peculiar sample preparation.
Results obtained with the TLS
In this work from Patskovsky et al. [1] gold plasmonic nanoparticles (AuNPs) targeting CD44+ human breast cancer cells are studied with hyperspectral darkfield imaging. This setup has been successfully used to perform 3D spectral localization and spectroscopic identification of CD44-targeted AuNPs in fixed cell preparations (see Fig. 1). “Such spatial and spectral information is essential for the improvement of nanoplasmonic-based imaging, disease detection and treatment in complex biological environments.”
![Darkfield images taken at different planes along the optical z axis using a 100X objective. The focal plane is positioned a) to the glass substrate surface (S points) or b) to the top surface of human breast cancer cells or inside the cell (C points). Adapted from [1].](https://tj.imgix.net/photonetc/nanoparticules-figure-1.jpg?v=1611250278&w=1500)
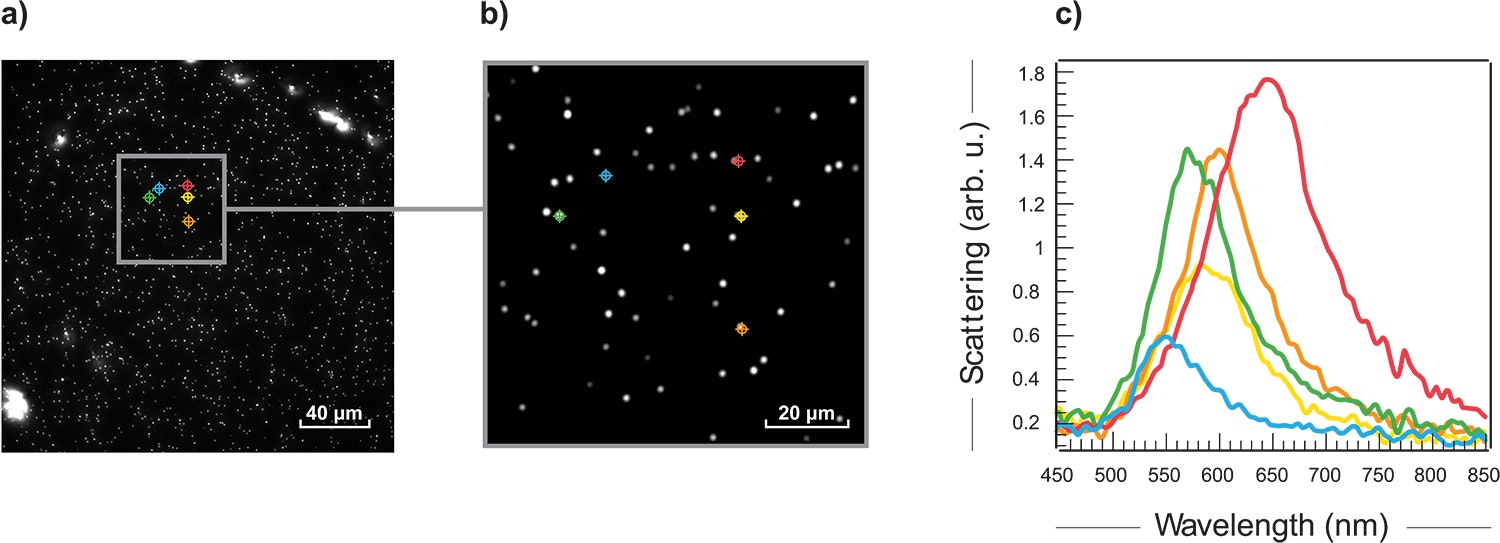
In collaboration with Prof. David Ginger from the University of Washington, 100 nm gold nanoparticles were studied using Photon etc.’s hyperspectral darkfield imager. Scattered data were acquired from 432 nm to 849 nm with 3 nm steps. Fig. 2 a) and b) shows the hyperspectral results and typical scattered spectra (c) extracted from the data. The shift in wavelengths can help identify the size of the particles and the spatial information can help assess their distribution.
Results obtained with IMA
In this work from Professor Michel Meunier’s research group from École Polytechnique de Montréal, IMA was used to study human breast cancer cells tagged with gold nanoparticles (AuNPs)
The high throughput of Photon etc.’s hyperspectral filter allows the rapid acquisition of spectrally resolved high-resolution images. Since the camera captures the whole image in the field of view, it is possible to collect information in real time and to follow the dynamics of cells and luminescent nanoscale components. PHySpec™, Photon etc.’s software, enables principal component analysis (PCA) in order to identify and localize the nanoparticles in the sample.
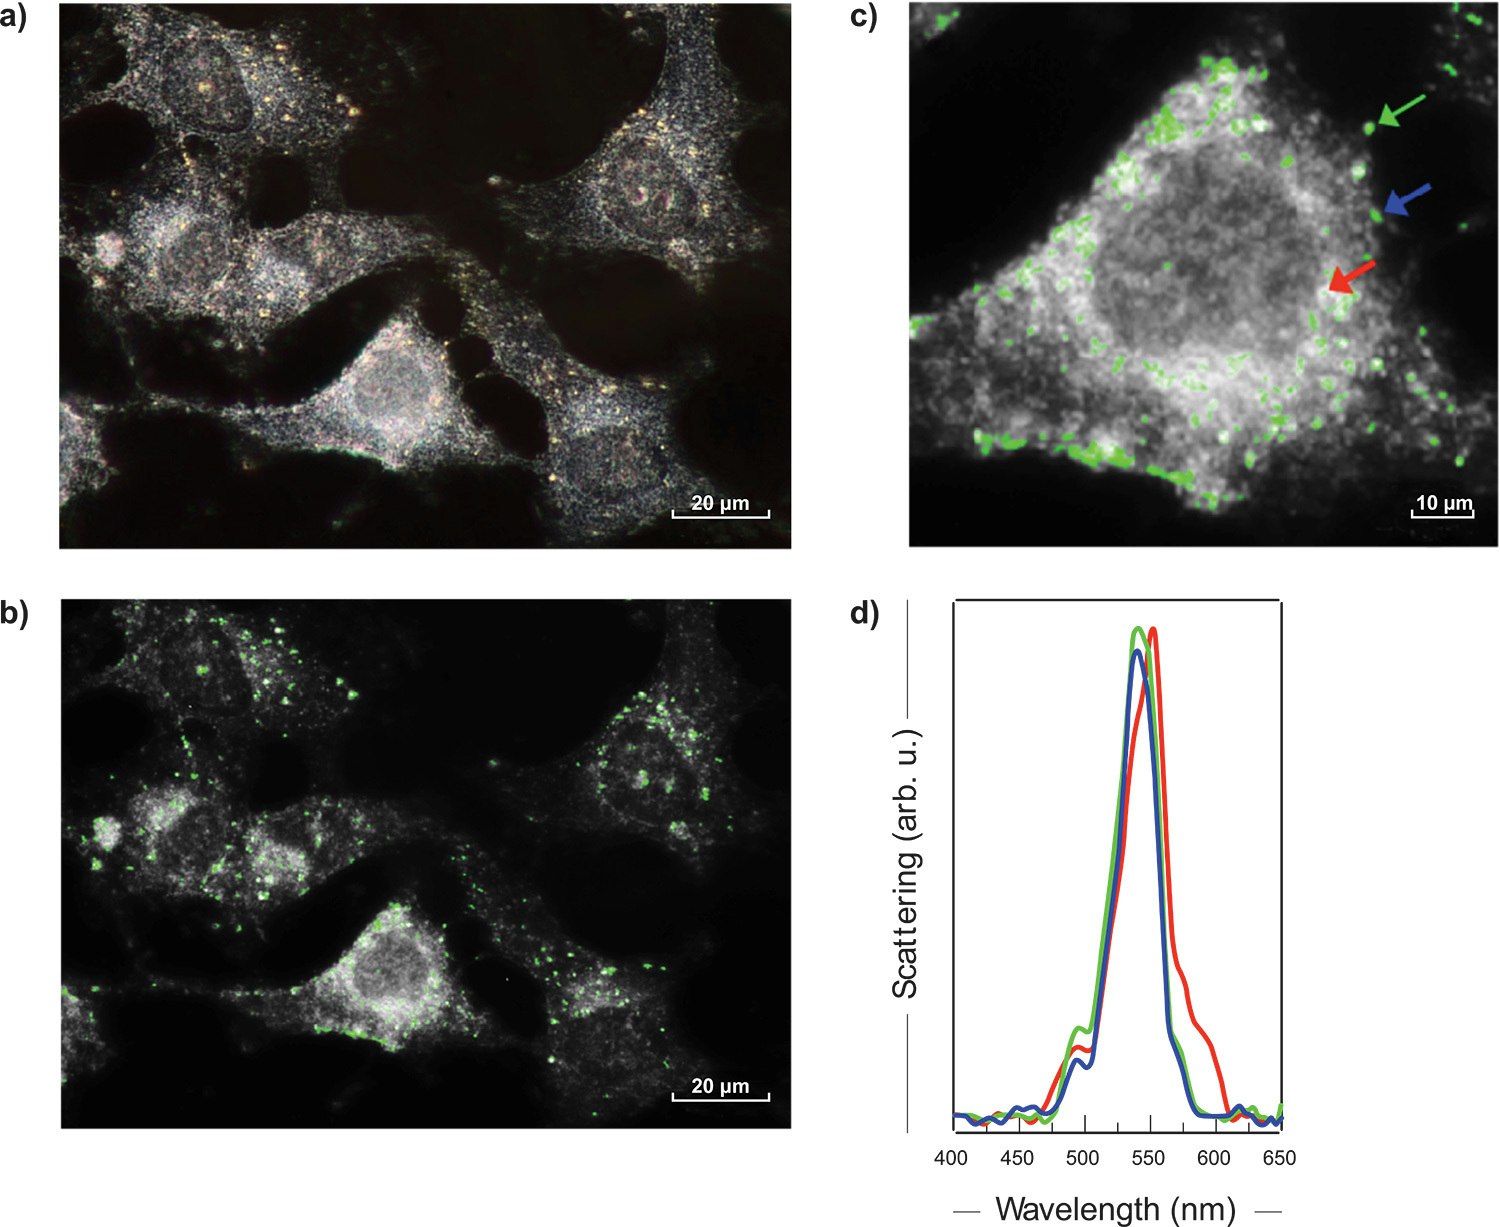
The figure 3 a) presents a darkfield image of MDA-MB-23 human breast cancer cells tagged with 60 nm AuNps. With a 60X objective, an area of 150 x 112 μm2 was imaged from 400 nm to 650 nm, with a step of 2 nm and an exposition time of 2 sec. per wavelength. In a few minutes, more than one million spectra were acquired, each of them covering the whole visible range.
Cells typically have a flat scattering spectrum, whereas AuNPs show a sharp peak around 550 nm. Fig. 3 b) illustrates the 550 nm image extracted from the darkfield hyperspectral cube of breast cancer. The AuNPs are marked with a green colouring after PCA software processing. The magnification of a breast cancer cell (Fig. 3 c) and the spectra of the regions containing AuNPs (some examples in Fig. 3 d) confirmed the presence of 60 nm nanoparticles.
For more information, contact info@photonetc.com
[1] Patskovsky, S., Bergeron, E., & Meunier, M. (2013). Hyperspectral darkfield microscopy of PEGylated gold nanoparticles targeting CD44-expressing cancer cells. Journal of Biophotonics, 8(1–2), 162–167.
Related Products

IMA™
IMA is a hyperspectral microscope delivering spectral and spatial information in the VIS, NIR and/or SWIR spectral ranges (400 nm - 1620 nm).